Logos |
|
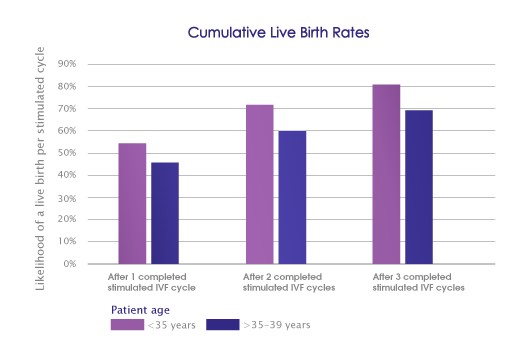
This chart shows the relation between patient age and successful IVF rates. It is clear that the more cycles performed, the more successful the rate of conception. This allows patients to realize just because the procedure is not successful the first time, doesn't mean it won't be successful in the future.
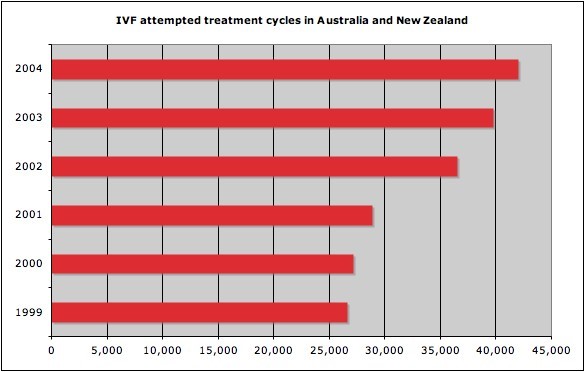
This chart shows the number of attempted treatment cycles in Australia and New Zealand. More people have attempted the process but that doesn't mean all were successful. This shows that just because more people are doing it, doesn't mean it has become a greater success.
